vue使用esri-loader切换底图并添加自定义图片
1. 问题描述
我想实现一个能够切换各种地图(如百度、谷歌地图)并在此基础上给上面叠一张某个朝代的地图,且这张朝代地图的经纬度与地图的经纬度相契合。项目是 vue 项目,使用 arcgis api 来实现上述功能。
2. 地图切换
2.1. 安装 esri-loader
首先需要引入 arcgis api,然后使用esri-loader来加载地图。
npm install esri-loader
2.2. 加载地图
通过网上搜索各个地图的api,目前先找了天地图、谷歌、高德地图的api,封装了一个加载地图的方法。
load-map.js
// load-map.js

function getMapOfTianditu (Basemap, WebTileLayer, TileInfo, SpatialReference) {
  const spatialReference = SpatialReference.WGS84
  const tileInfo = new TileInfo({
    dpi: 90.71428571427429,
    lods: [
      { level: 0, levelValue: '1', scale: 295828763.79585470937713011037, resolution: 0.703125 },
      { level: 1, levelValue: '2', scale: 147914381.89792735468856505518, resolution: 0.3515625 },
      { level: 2, levelValue: '3', scale: 73957190.948963677344282527592, resolution: 0.17578125 },
      { level: 3, levelValue: '4', scale: 36978595.474481838672141263796, resolution: 0.087890625 },
      { level: 4, levelValue: '5', scale: 18489297.737240919336070631898, resolution: 0.0439453125 },
      { level: 5, levelValue: '6', scale: 9244648.868620459668035315949, resolution: 0.02197265625 },
      { level: 6, levelValue: '7', scale: 4622324.4343102298340176579745, resolution: 0.010986328125 },
      { level: 7, levelValue: '8', scale: 2311162.2171551149170088289872, resolution: 0.0054931640625 },
      { level: 8, levelValue: '9', scale: 1155581.1085775574585044144937, resolution: 0.00274658203125 },
      { level: 9, levelValue: '10', scale: 577790.55428877872925220724681, resolution: 0.001373291015625 },
      { level: 10, levelValue: '11', scale: 288895.2771443893646261036234, resolution: 0.0006866455078125 },
      { level: 11, levelValue: '12', scale: 144447.63857219468231305181171, resolution: 0.00034332275390625 },
      { level: 12, levelValue: '13', scale: 72223.819286097341156525905853, resolution: 0.000171661376953125 },
      { level: 13, levelValue: '14', scale: 36111.909643048670578262952926, resolution: 0.0000858306884765625 },
      { level: 14, levelValue: '15', scale: 18055.954821524335289131476463, resolution: 0.00004291534423828125 },
      { level: 15, levelValue: '16', scale: 9027.977410762167644565738231, resolution: 0.000021457672119140625 },
      { level: 16, levelValue: '17', scale: 4513.9887053810838222828691158, resolution: 0.0000107288360595703125 },
      { level: 17, levelValue: '18', scale: 2256.9943526905419111414345579, resolution: 0.00000536441802978515625 },
      { level: 18, levelValue: '19', scale: 1128.4971763452709555707172788, resolution: 0.000002682209014892578125 }
    ],
    size: [256, 256],
    origin: {
      x: -180,
      y: 90
    },
    spatialReference
  })

  const webTileLayer = new WebTileLayer({
    urlTemplate: 'http://{subDomain}.tianditu.gov.cn/vec_c/wmts?SERVICE=WMTS&REQUEST=GetTile&VERSION=1.0.0&LAYER=vec&STYLE=default&TILEMATRIXSET=c&FORMAT=tiles&TILEMATRIX={level}&TILEROW={row}&TILECOL={col}&tk=b854fdb3a3b2625bd6c8353e83f7cca3',
    subDomains: ['t0', 't1', 't2', 't3', 't4', 't5', 't6', 't7'],
    tileInfo,
    spatialReference,
    opacity: 1
  })
  const basemap = new Basemap({
    baseLayers: [webTileLayer]
  })
  return basemap
}

function getMapByUrlTemplate (Basemap, WebTileLayer, urlTemplate, subDomains) {
  const layerData = {
    urlTemplate
  }
  if (subDomains) {
    layerData.subDomains = subDomains
  }
  const webTileLayer = new WebTileLayer(layerData)
  const basemap = new Basemap({
    baseLayers: [webTileLayer]
  })
  return basemap
}

const mapUrlSet = {
  'google': { url: 'https://mt1.google.com/vt/lyrs=m&x={col}&y={row}&z={level}' },
  // 'google': 'https://mt1.google.com/vt/lyrs=m&x={col}&y={row}&z={level}&s=Galil',
  'amap1': { url: 'https://webst01.is.autonavi.com/appmaptile?style=6&x={col}&y={row}&z={level}' },
  'amap2': { url: 'https://webrd02.is.autonavi.com/appmaptile?lang=zh_cn&size=1&scale=1&style=8&x={col}&y={row}&z={level}' }
  // 'tencent': { url: 'https://rt2.map.gtimg.com/tile?z={level}&x={col}&y={row}&type=vector&styleid=3&version=110' }
}

export function loadMap (mapName, Basemap, WebTileLayer, TileInfo, SpatialReference) {
  if (mapUrlSet[mapName]) {
    const temp = mapUrlSet[mapName]
    return getMapByUrlTemplate(Basemap, WebTileLayer, temp.url, temp.subDomains)
  } else {
    return getMapOfTianditu(Basemap, WebTileLayer, TileInfo, SpatialReference)
  }
}
然后在vue里调用这个方法,加载地图。
MapTest.vue
<template>
  <div class="main-container">
    <!-- 地图选择 -->
    <el-select class="my-select" v-model="currentMapChoice" value-key="key" placeholder="请选择地图" @change="handleMapChange">
      <el-option
        v-for="item in mapChoices"
        :key="item.key"
        :label="item.name"
        :value="item">
      </el-option>
    </el-select>
    <div id="map-container"></div>
  </div>
</template>

<script>
import { loadModules } from 'esri-loader'
import { loadMap } from './load-map'

export default {
  data () {
    return {
      mapView: null,
      mapChoices: [
        { name: '天地图', key: 'tianditu' },
        { name: '谷歌地图', key: 'google' },
        { name: '高德地图-卫星', key: 'amap1' },
        { name: '高德地图-街道', key: 'amap2' }
      ],
      currentMapChoice: null
    }
  },
  methods: {

    loadMap (mapName) {
      loadModules(
        [
          'esri/views/MapView',
          'esri/Basemap',
          'esri/Map',
          'esri/layers/WebTileLayer',
          'esri/layers/support/TileInfo',
          'esri/geometry/SpatialReference'
        ],
        { css: true }
      ).then(
        ([MapView,
          Basemap,
          Map,
          WebTileLayer,
          TileInfo,
          SpatialReference]) => {
          const basemap = loadMap(mapName, Basemap, WebTileLayer, TileInfo, SpatialReference)
          const map = new Map({ basemap })
          const view = new MapView({
            map,
            container: 'map-container',
            center: [113, 36],
            zoom: 3
          })
          this.mapView = view
        }
      )
    },
    handleMapChange (value) {
      document.getElementById('map-container').innerHTML = ''
      this.loadMap(value.key)
    }
  }
}
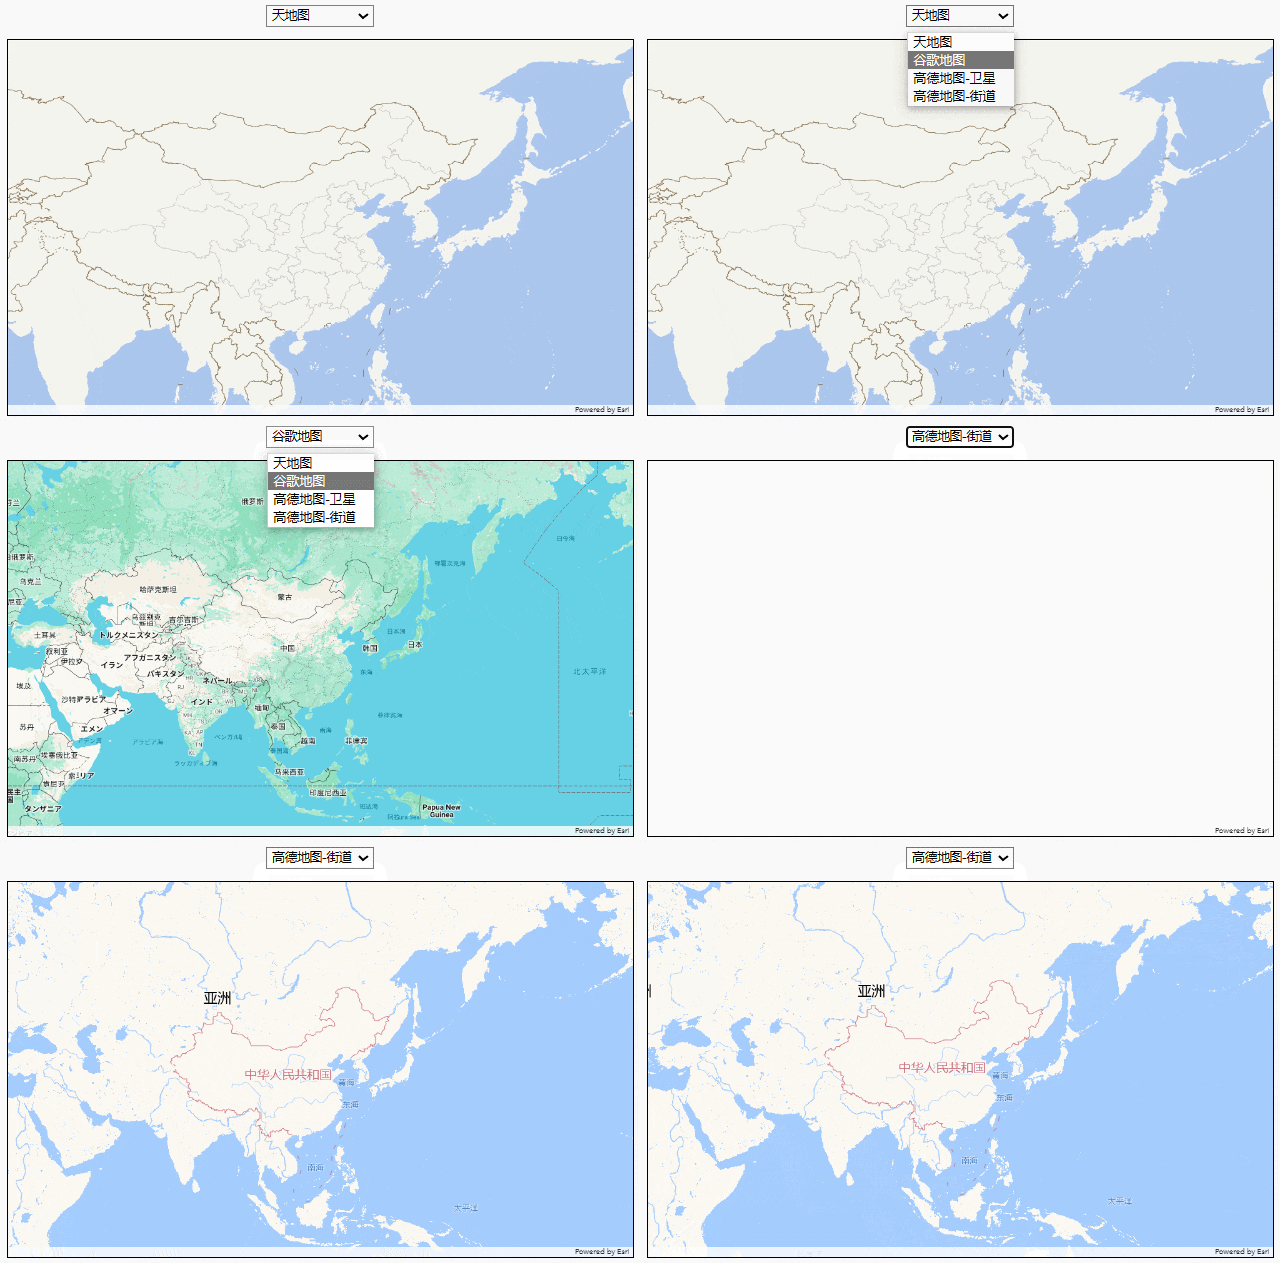
效果如下:
3. 添加各朝代地图
3.1. 获取各朝代地图
从网上搜索谭其骧主编的《中国历史地图集》中找到了各朝代的地图。每张地图上基本都有一部分经纬度信息,可以通过这些信息来定位它在地图上的位置。将每个朝代的地图比对好经纬度后,得到下面的数据:
mapData: [
  { 'dynasty': '春秋', 'mapName': '01-20春秋时期全图.jpg', left: 60, top: 58, right: 140, bottom: 17 },
  { 'dynasty': '战国', 'mapName': '01-31战国时期全图.jpg', left: 60, top: 58, right: 140, bottom: 17 },
  { 'dynasty': '秦', 'mapName': '02-3秦时期全图.jpg', left: 60, top: 58, right: 140, bottom: 17 },
  { 'dynasty': '汉', 'mapName': '02-13西汉时期全图.jpg', left: 60, top: 58, right: 140, bottom: 17 },
  { 'dynasty': '三国', 'mapName': '03-3三国时期全图.jpg', left: 60, top: 58, right: 140, bottom: 17 },
  { 'dynasty': '东晋', 'mapName': '东晋十六国时期.jpg', left: 60, top: 58, right: 140, bottom: 17 },
  { 'dynasty': '南北朝', 'mapName': '04-17宋、魏时期全图.jpg', left: 60, top: 58, right: 140, bottom: 17 },
  { 'dynasty': '隋', 'mapName': '05-3隋时期全图.jpg', left: 60, top: 58, right: 140, bottom: 17 },
  { 'dynasty': '唐', 'mapName': '05-32唐时期全图(一).jpg', left: 60, top: 58, right: 140, bottom: 17 },
  { 'dynasty': '五代', 'mapName': '05-82五代十国时期全图.jpg', left: 60, top: 58, right: 140, bottom: 17 },
  { 'dynasty': '北宋', 'mapName': '辽.北宋时期.jpg', left: 60, top: 58, right: 140, bottom: 17 },
  { 'dynasty': '南宋', 'mapName': '金.南宋时期.jpg', left: 60, top: 58, right: 140, bottom: 17 },
  { 'dynasty': '元', 'mapName': '元初期.jpg', left: 60, top: 58, right: 140, bottom: 17 },
  { 'dynasty': '明', 'mapName': '07-40明时期全图(一).jpg', left: 60, top: 58, right: 140, bottom: 17 },
  { 'dynasty': '清', 'mapName': '08-3清时期全图(一).jpg', left: 60, top: 58, right: 140, bottom: 17 }
]
left、top、right、bottom分别表示图片的左上角和右下角的经纬度。
然后将地图部署到nginx上,通过nginx的http://localhost:8084/maps/访问。
server {
    listen       8084;
    server_name  localhost;

    location /maps {
      add_header 'Access-Control-Allow-Origin' '*';
			root	files;
			autoindex	on;
		}
}
当然也可以直接用require来引入图片,我测试时使用的是nginx。
3.2. 添加朝代地图
目前尝试了以下几种方法:
3.2.1. 使用esri/Graphic来添加图片
在比较早的版本可以用esri/layers/MapImageLayer, esri/layers/MapImage来添加图片,具体操作就是创建一个MapImageLayer图层并添加到地图中,然后调用它的addImage方法添加一个MapImage。我试过这种方式,发现一个很大的问题就是图片的分辨率很糟糕,放大图片后原本图片中的信息基本看不清楚。
我现在使用的是esri-loader v3.7.0,这个版本的MapImage移到了esri/layers/support/MapImage,且它的MapImageLayer已经没有addImage方法了,所以我采用了另一种方式,就是使用esri/Graphic来添加图片。
getPictureSize (mapData) {
  const scale = this.calculateScale(this.mapView)
  const width = (mapData.right - mapData.left) * scale.x
  const height = (mapData.top - mapData.bottom) * scale.y
  return {
    width: `${width}px`,
    height: `${height}px`
  }
},
generatePictureSymbol (mapData) {
  const size = this.getPictureSize(mapData)
  const pictureSymbol = {
    type: "picture-marker",
    url: `${this.mapRootUrl}${mapData.mapName}`,
    ...size
  }
  const point = {
    type: "point",
    longitude: mapData.left + (mapData.right - mapData.left) / 2,
    latitude: mapData.top + (mapData.bottom - mapData.top) / 2,
  }
  return new this.Graphic({
    geometry: point,
    symbol: pictureSymbol,
  })
},
handleDynastyChange () {
  this.mapView.graphics.removeAll()
  if (this.currentMapData.dynasty === '无') {
    return
  }
  this.mapView.graphics.add(this.generatePictureSymbol(this.currentMapData))
},
loadMap (mapName) {
  loadModules(
    [ ..., 'esri/Graphic' ],
    { css: true }
  ).then(
    ([..., Graphic]) => {
      this.Graphic = Graphic
      this.mapView = view
      view.watch('scale', () => {
        this.handleDynastyChange()
      })
    }
  )
}
清除图片用this.mapView.graphics.removeAll(),添加图片用this.mapView.graphics.add(),这样就可以在地图上添加图片了。记得监听地图的scale事件,因为地图缩放时,图片的大小也需要相应的改变。
效果如下:
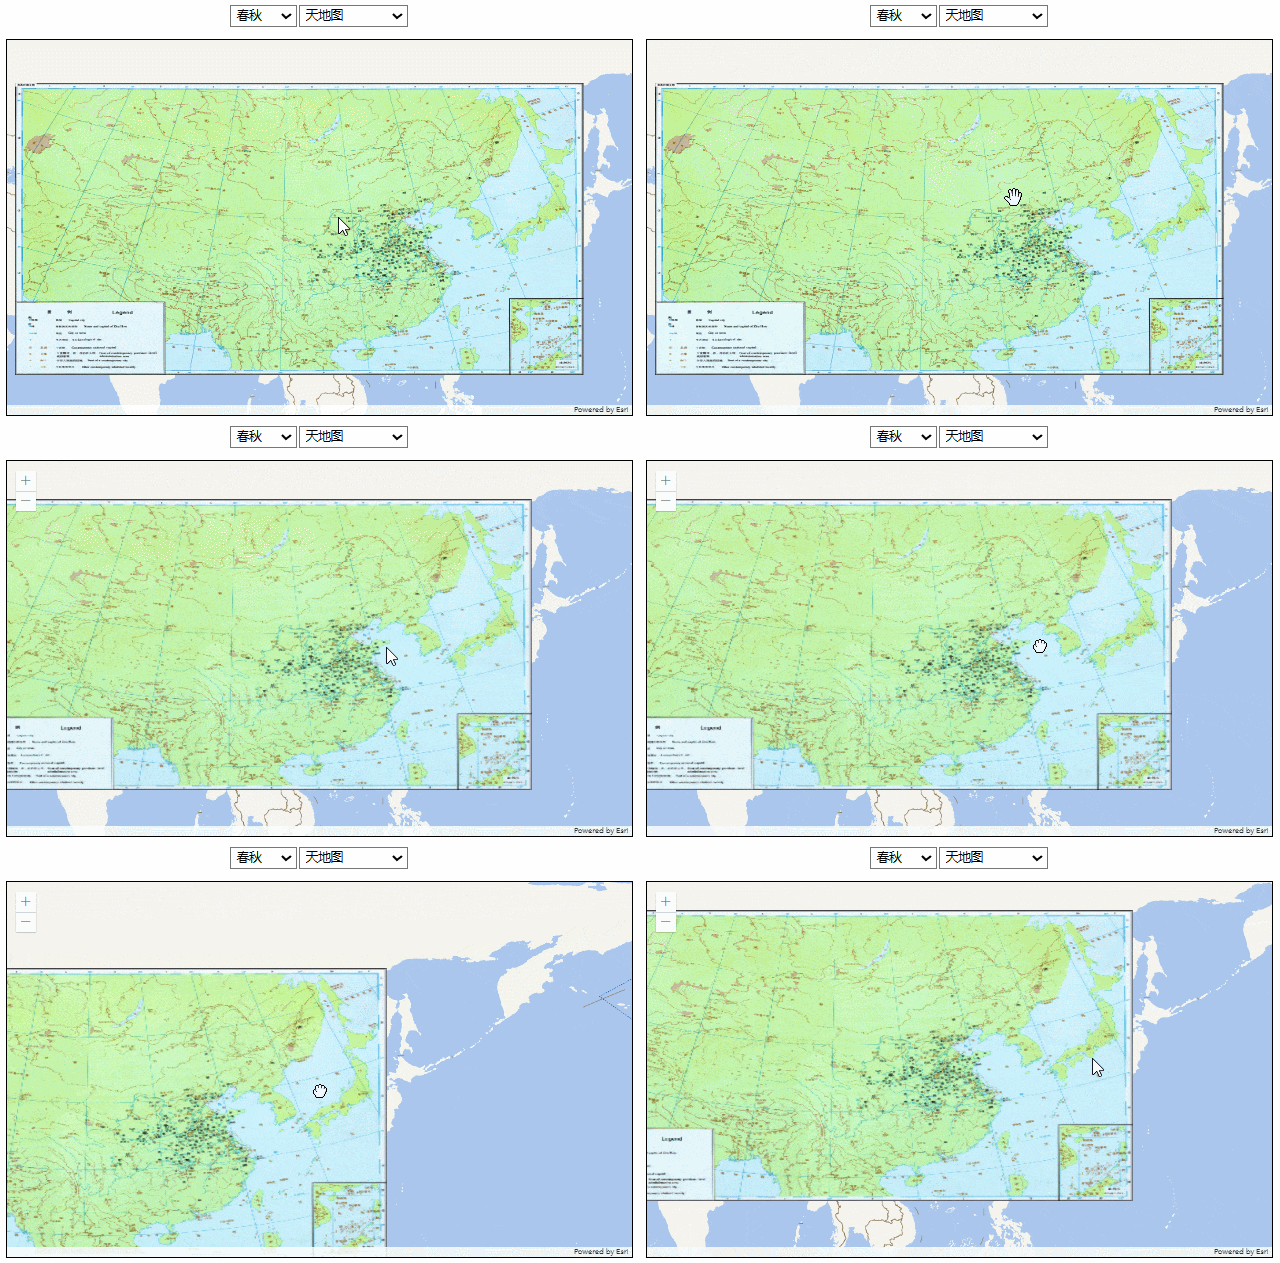
这种方式的缺陷也很明显,一是缩放时动画不流畅,二是图片的分辨率不高,放大后看不清楚。
3.2.2. 在地图上添加一个div来放置图片
在map-container外面添加一个relative定位的div,然后在这个div里面添加一个absolute定位的div用于放置图片,图片设置一定的透明度。图片的大小和位置通过计算经纬度来确定。这里我采用的方式是随便在地图上取两个点,然后计算这两个点的经纬度与屏幕坐标的比例,然后根据这个比例来计算图片的位置。
calculateScale (mapView) {
  const mapPoint1 = {
    x: 103,
    y: 33,
    spatialReference: {
      wkid: 4326
    }
  }
  const mapPoint2 = {
    x: 113,
    y: 43,
    spatialReference: {
      wkid: 4326
    }
  }
  const screenPoint1 = mapView.toScreen(mapPoint1)
  const screenPoint2 = mapView.toScreen(mapPoint2)
  const scaleX = Math.abs(screenPoint1.x - screenPoint2.x) / Math.abs(mapPoint1x - mapPoint2.x)
  const scaleY = Math.abs(screenPoint1.y - screenPoint2.y) / Math.abs(mapPoint1y - mapPoint2.y)
  return { x: scaleX, y: scaleY }
}
然后分别计算图片的左上角和右下角的经纬度,然后通过这两个经纬度来计算图片的位置。
updateImagePosition (mapView, leftTop, rightBottom) {
  if (!mapView) { return }
  let scale
  try {
    scale = this.calculateScale(mapView)
  } catch (e) {
    return
  }
  const imgWidth = Math.abs(leftTop.x - rightBottom.x) * scale.x
  const imgHeight = Math.abs(leftTop.y - rightBottom.y) * scale.y
  const newLeftTop = mapView.toScreen({x: leftTop.x, y: leftTop.y, spatialReference: { wkid: 4326 }}) // 左上角
  const img = document.querySelector('.image-layer')
  if (!img) { return }
  img.style.width = imgWidth + 'px'
  img.style.height = imgHeight + 'px'
  img.style.left = newLeftTop.x + 'px'
  img.style.top = newLeftTop.y + 'px'
},
updateImage () {
  const mapView = this.mapView
  const leftTop = { x: this.currentMapData.left, y: this.currentMapData.top }
  const rightBottom = { x: this.currentMapData.right, y: this.currentMapData.bottom }
  this.updateImagePosition(mapView, leftTop, rightBottom)
}
还有一个需要处理的问题就是图片如果覆盖在地图之上,那么像移动地图和缩放地图这些操作就会被图片给遮挡住,而给图片添加pointer-events: none的样式似乎无法让鼠标事件穿透图片。所以打算采用事件传递的方式,当鼠标在图片上时,将事件传递给地图。
<template>
  <div class="outer-container">
    <div id="map-container"></div>
    <div class="image-layer"
      @wheel.stop="dispatchEventToMap($event, 'wheel')"
      @mousedown.stop="handleImageLayerMouseDown"
      @mouseup.stop="handleImageLayerMouseUp"
      @mousemove.stop="handleImageLayerMouseMove"
      @mouseleave.stop="handleImageLayerMouseUp">
    </div>
  </div>
</template>

<script>
import { loadModules } from 'esri-loader'

export default {
  data() {
    return {
      mapView: null,
      mouseDown: false,
      mouseDownPoint: { x: 0, y: 0 },
      mouseDownMapCenter: { x: 0, y: 0 },
      // other data
    }
  },
  methods: {
    dispatchEventToMap (event, type) {
      this.mouseDown = false
      document.body.style.cursor = 'default'
      const tempCanvas = document.querySelector('#map-container .esri-view-root .esri-view-surface canvas')
      let tempEvent = new WheelEvent(type, event)
      tempCanvas.dispatchEvent(tempEvent)
    },
    handleImageLayerMouseDown (event) {
      this.mouseDown = true
      this.mouseDownPoint = { x: event.clientX, y: event.clientY }
      this.mouseDownMapCenter = this.mapView.center
    },
    handleImageLayerMouseUp (event) {
      this.mouseDown = false
      document.body.style.cursor = 'default'
    },
    handleImageLayerMouseMove (event) {
      if (this.mouseDown) {
        const deltaX = event.clientX - this.mouseDownPoint.x
        const deltaY = event.clientY - this.mouseDownPoint.y
        // 将鼠标形状设置为move
        document.body.style.cursor = 'grab'
        const originCenter = this.mapView.toScreen({
          x: this.mouseDownMapCenter.longitude,
          y: this.mouseDownMapCenter.latitude,
          spatialReference: {
            wkid: 4326
          }
        })
        const newCenter = {
          x: originCenter.x - deltaX,
          y: originCenter.y - deltaY
        }
        const newCenterMapPoint = this.mapView.toMap(newCenter)
        this.mapView.center = [newCenterMapPoint.longitude, newCenterMapPoint.latitude]
      }
    }
    // other methods
  },
  loadMap (mapName) {
    loadModules(
      ...
    ).then(
      (...) => {
        view.watch('scale', () => {
          this.updateImage()
        })

        // 移动地图
        view.watch('center', () => {
          this.updateImage()
        })

        this.updateImage()
      }
    )
  },
}
鼠标滚轮缩放事件可以直接传递给地图,但是鼠标移动事件需要计算移动的距离,然后通过计算得到新的地图中心点。所以我在mousemove事件中计算了鼠标移动的距离,然后通过这个距离来计算新的地图中心点,然后将地图的中心点设置为这个新的中心点,同时将鼠标形状设置为grab。相应的在触发地图的scale和center事件时,也需要更新图片的位置。
esri-loader地图上自带了缩放的加号和减号图标,上述方式图片会覆盖在这两个图标之上,所以需要将这两个图标隐藏掉。
#map-container >>> .esri-ui-top-left {
  display: none;
}
效果如下:
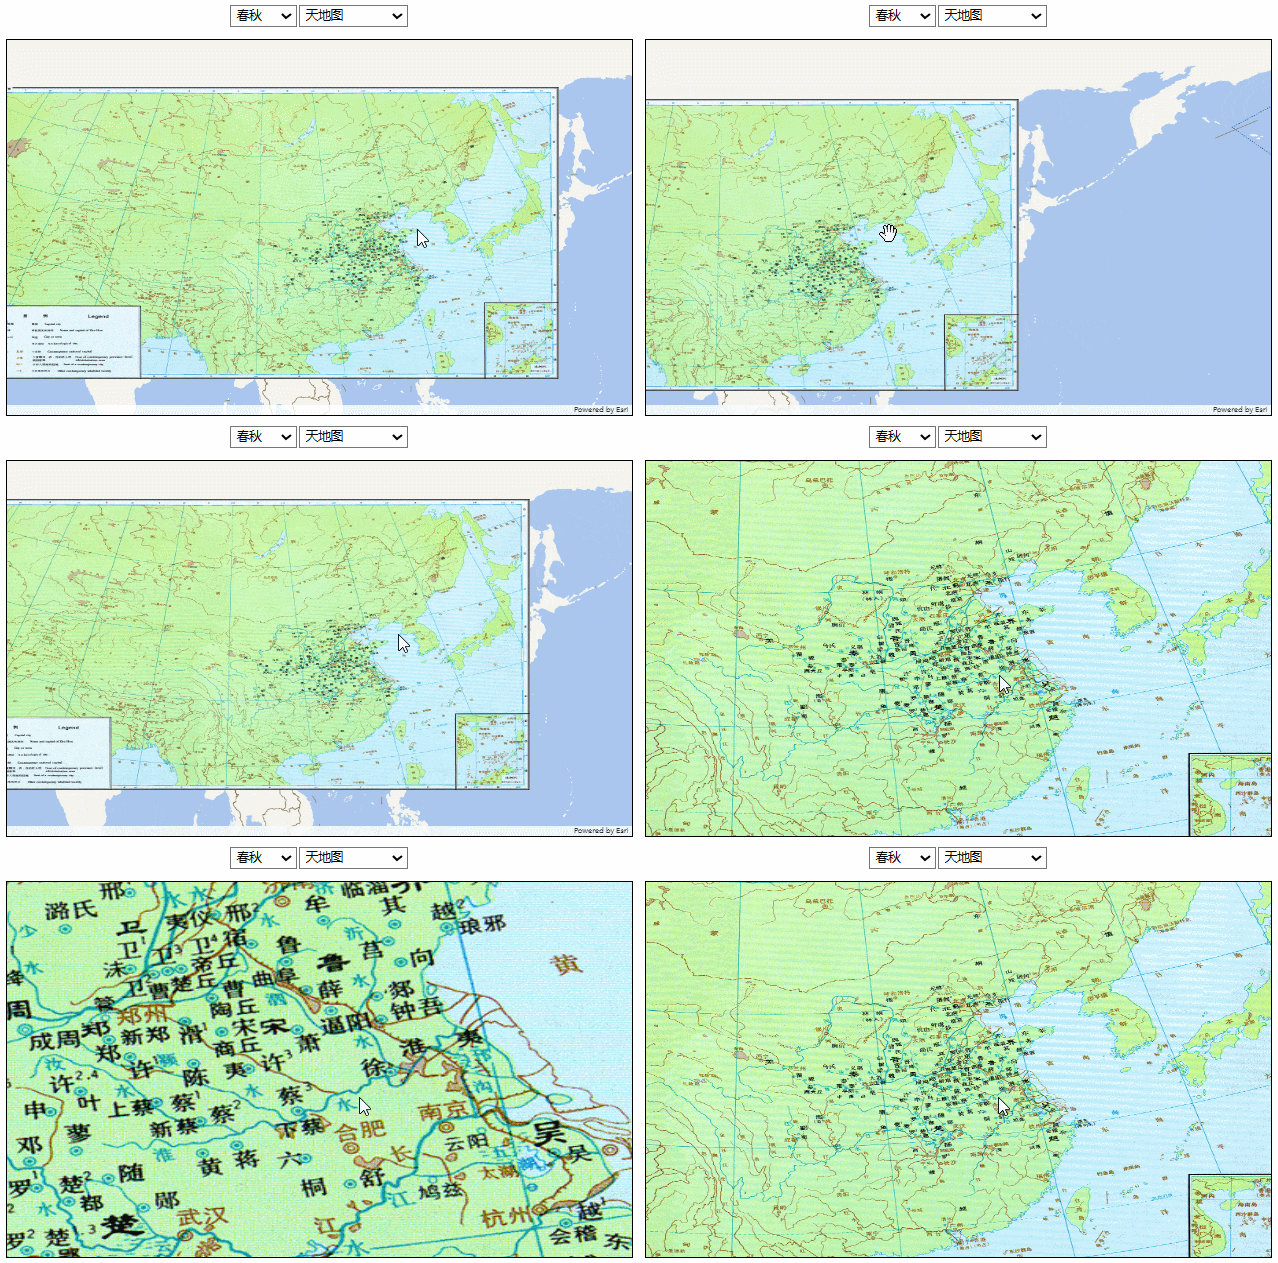
相比上面的方法,图片分辨率没有太大问题,移动和缩放也相当流畅。但在后续的一些操作中,比如我想给地图加一些点或者线,这些点或线会被图片遮挡住,处理起来也比较麻烦。
3.2.3. 使用esri/BaseDynamicLayer
BaseDynamicLayer是一个抽象类,可以通过继承这个类来实现自定义图层。官方文档:https://developers.arcgis.com/javascript/latest/api-reference/esri-layers-BaseDynamicLayer.html。
handleDynastyChange () {
  // 清除之前的图片
  if (this.currentPictureLayer) {
    this.mapView.map.remove(this.currentPictureLayer)
  }
  if (this.currentMapData.dynasty === '无') {
    return
  }
  const pictureUrl = this.mapRootUrl + this.currentMapData.mapName
  this.currentPictureLayer = new this.MyCustomDynamicLayer({
    pictureUrl, mapData: this.currentMapData
  })
  this.mapView.map.add(this.currentPictureLayer)
},
loadMap (mapName) {
  loadModules(
    [
      ...,
      'esri/layers/BaseDynamicLayer',
      'esri/request'
    ],
    { css: true }
  ).then(
    ([...,
      BaseDynamicLayer,
      esriRequest]) => {
      const basemap = loadMap(mapName, Basemap, WebTileLayer, TileInfo, SpatialReference)
      const map = new Map({ basemap })
      const view = new MapView({
        map, container: 'map-container', center: [113, 36], zoom: 3
      })
      this.mapView = view

      this.MyCustomDynamicLayer = BaseDynamicLayer.createSubclass({
        // properties of the custom dynamic layer
        properties: {
          pictureUrl: null,
          mapData: null
        },
        // override getImageUrl() to generate URL to the image
        getImageUrl: function (extent, width, height) {
          return this.pictureUrl
        },
        // Fetches images for given extent and size
        fetchImage: function (extent, width, height){
          let url = this.getImageUrl(extent, width, height);
          // request for the image based on the generated url
          return esriRequest(url, {
            responseType: "image"
          })
          .then(function(response) {
            let image = response.data;
            // create a canvas with teal fill
            let canvas = document.createElement("canvas");
            let context = canvas.getContext("2d");
            canvas.width = width;
            canvas.height = height;
            if (extent.xmin === -180) {
              // 地图移动到了左边界,直接隐藏
              return canvas
            }
            const tempMapData = this.mapData
            const leftTop = view.toScreen({ x: tempMapData.left, y: tempMapData.top })
            const rightBottom = view.toScreen({ x: tempMapData.right, y: tempMapData.bottom })
            // Apply destination-atop operation to the image returned from the server
            context.fillStyle = "rgb(0,200,200)";
            context.globalCompositeOperation = "destination-atop";
            context.drawImage(image, leftTop.x, leftTop.y, rightBottom.x - leftTop.x, rightBottom.y - leftTop.y);
            return canvas;
          }.bind(this));
        }
      })
      view.when(() => {
        this.handleDynastyChange()
      })
      const resetButton = document.getElementById('reset-button')
      // 添加按钮点击事件
      resetButton.addEventListener('click', function () {
      // 重新设置地图中心位置
        view.center = [112, 29]
        view.zoom = 3
      })
    }
  )
}
使用BaseDynamicLayer.createSubclass方法,添加了pictureUrl和mapData两个属性,然后重写了getImageUrl和fetchImage方法。getImageUrl方法返回图片的 url,fetchImage方法用来获取图片,然后将图片绘制到canvas上。在绘制图片时,需要将图片的经纬度转换为屏幕坐标,然后绘制图片。
每次切换朝代地图时,需要先移除之前的图片,然后添加新的图片: this.mapView.map.add(...)和this.mapView.map.remove(...)。
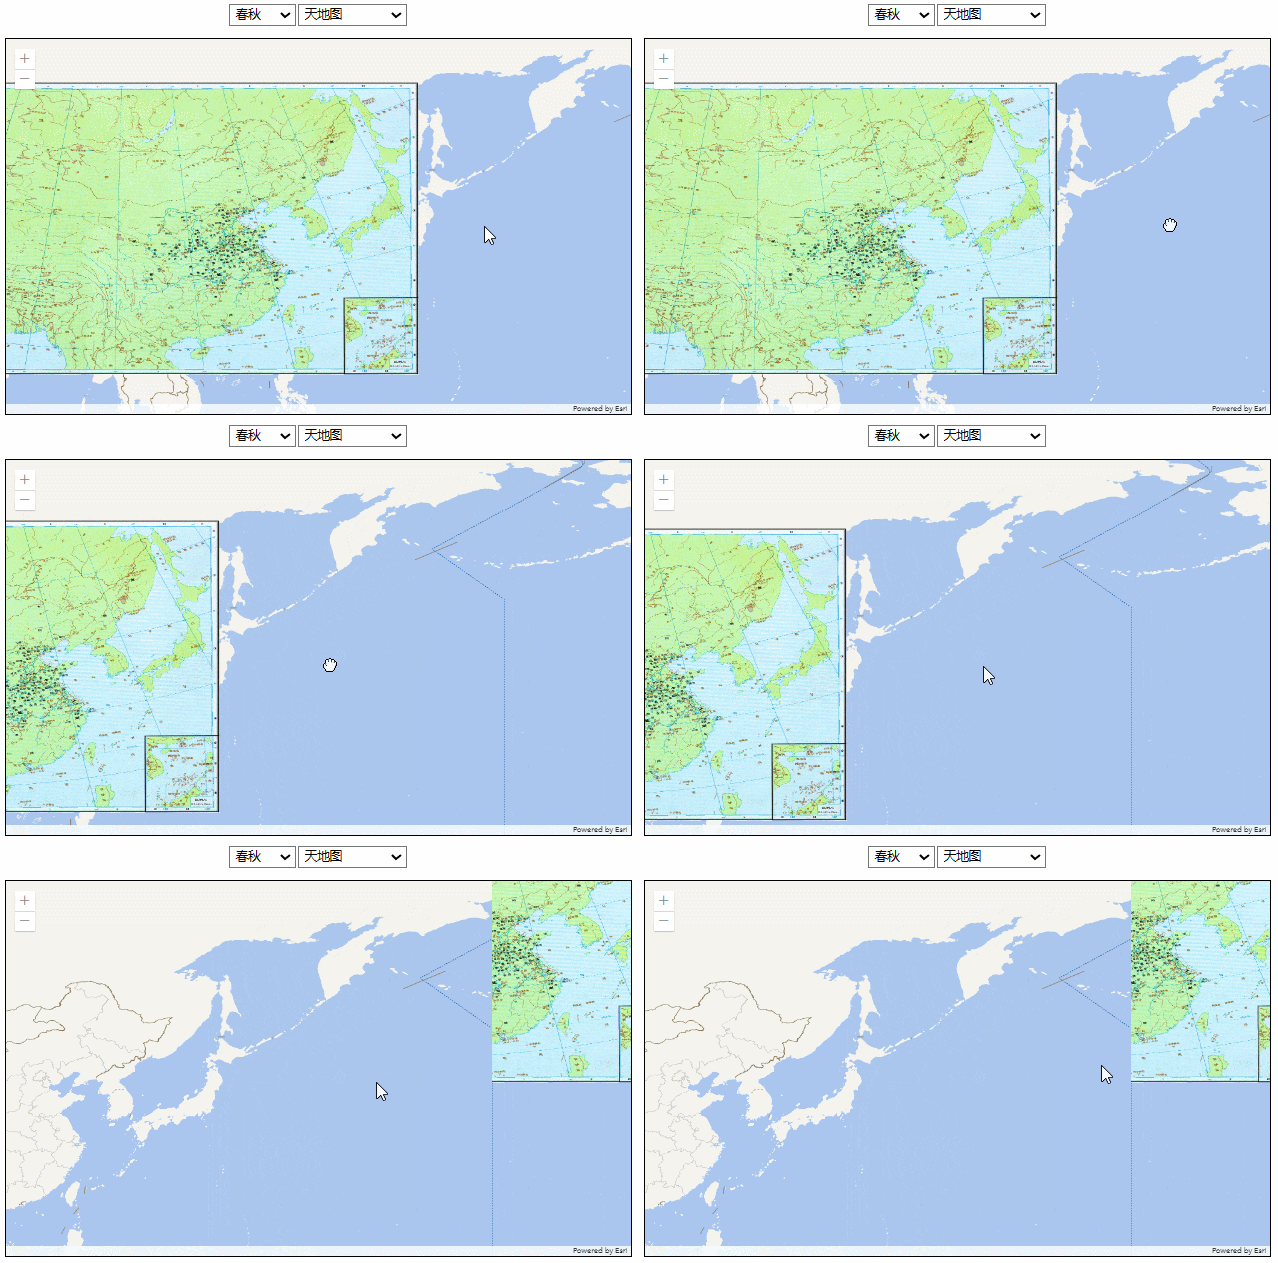
效果如下:
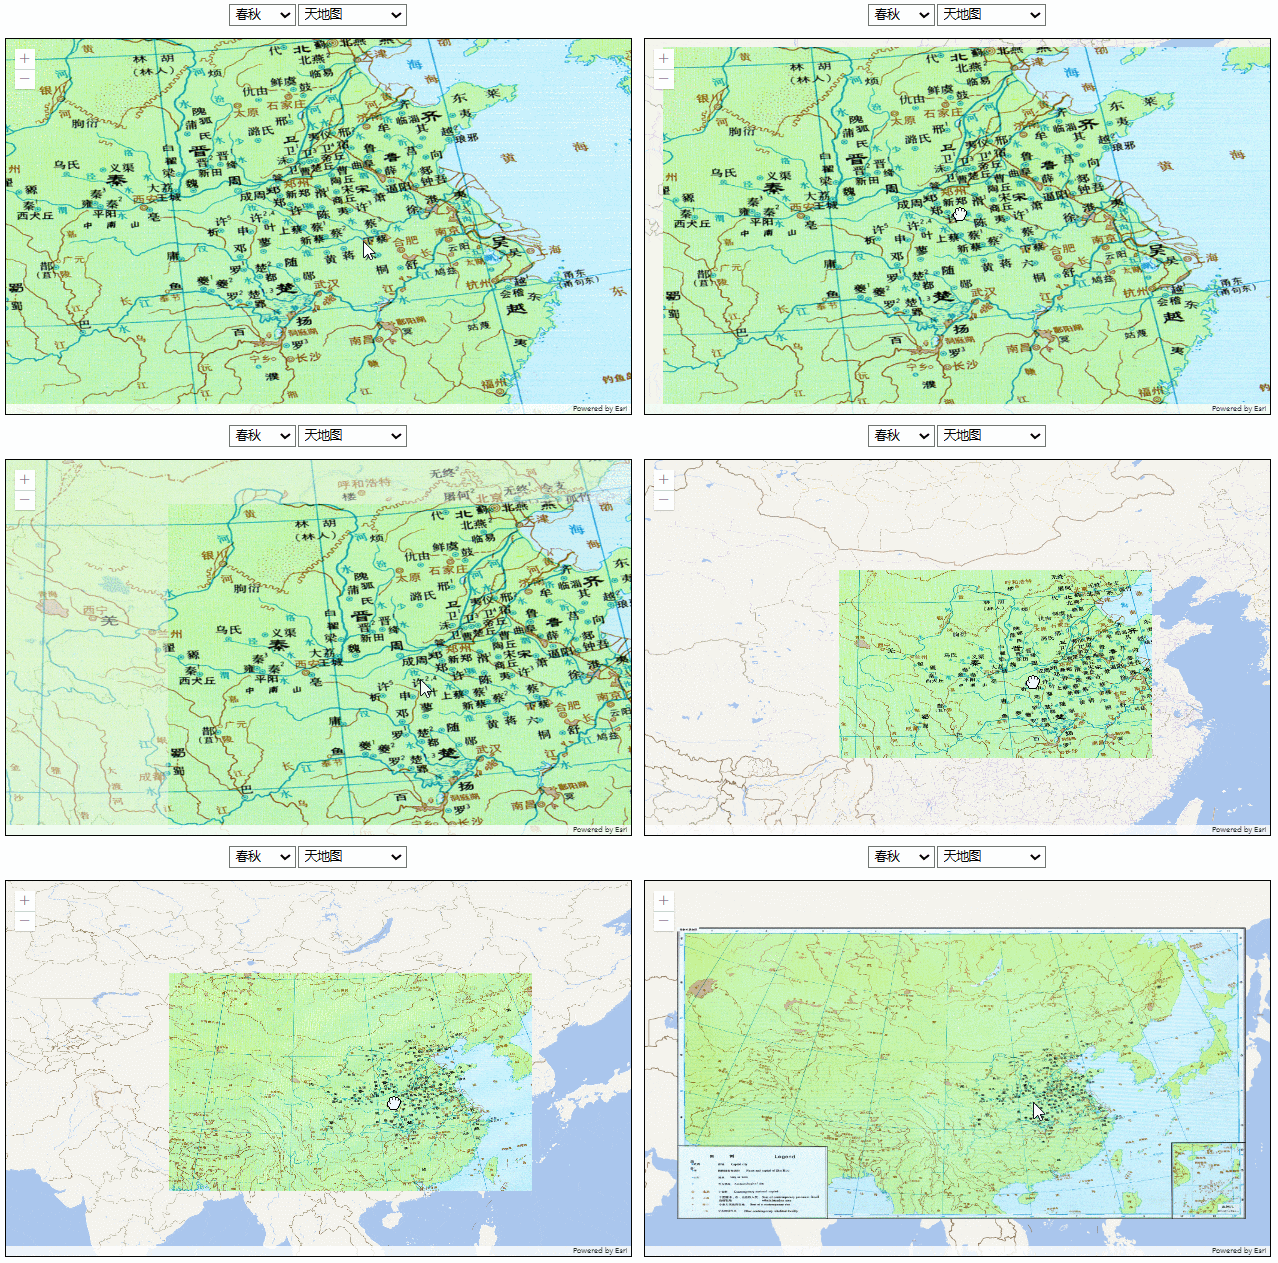
这种方式图片的分辨率没有问题,但有两个明显的缺陷:
- 移动和缩放地图时,会有明显的延迟。因为
fetchImage仅会在移动和缩放的动画结束后才会调用,而且该方法中的esriRequest方法也会有一定的延迟。 - 一旦地图移动到了右侧的边界,
fetchImage所生成的canvas的横坐标就会变到地图右侧的边界,但是通过view.toScreen方法转换的坐标还是在地图内部,这样的话图片的位置就会出现严重偏差。而且没法通过canvas的css样式将canvas的坐标移回去。所以不得不在到达边界时(extent.xmin === -180)直接隐藏图片。
4. 总结
本次添加地图图片的工作最主要的问题在于将图片正确的显示在地图上。上面的三种方法各有优缺点。分辨率除了第一种方法,其他两种方法都没有问题。操作的流畅度上,第三种方法最差,第一种方法次之,第二种方法最好。只有第二种方法会影响后续的标记位置等操作。所以整体上来说,根据实际需求选择第二种或者第三种方法比较好,某些极端情况对分辨率无要求的话,第一种方法也可以。
5. 源代码
代码地址:https://github.com/lxmghct/my-vue-components
在src/views/map-test目录下。其中Test1.vue, Test2.vue, Test3.vue分别对应上述的三种方法。